C / O measurement in column and open wells
Carbon-Oxygen Register for monitoring reservoirs in unknown or freshwater formations
The carbon-oxygen (C / O) register is used to estimate oil saturation after the outer layer is framed. Since the C / O register is based on the carbon and oxygen index of the reservoir fluid, this interpretation is independent of the salinity of the formation water. Before explaining the Carbon-Oxygen register, we are first reviewing the basics of its interpretation.
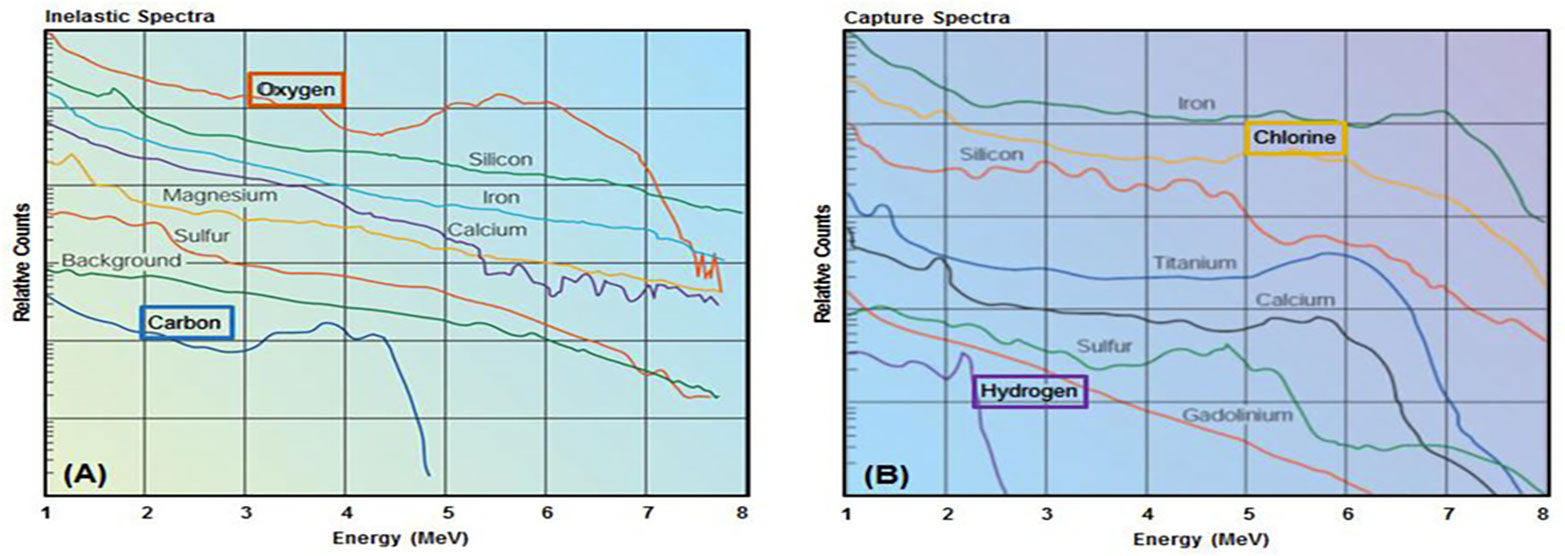
Primary data for the carbon-oxygen (C / O) register are obtained in the inelastic high-energy range, which is between 8 and 14 mev. The pulsed neutron generator produces high-energy inelastic neutrons – 14 mev energy within a short burst. The collision of these neutrons with elements of different formations results in an inelastic collision with high energy. This collision causes the environment of the well formations and nuclides to become excited. These nuclides charge themselves by emitting characteristic gamma rays of energy, depending on their atomic number. The data recorded in this mode are used to provide the values of the carbon-oxygen ratio, the calcium-silicon ratio, the inelastic counting rate and the different yields of the inelastic elements from both near and far detectors. Other measurements relate to the inelastic count distance ratio and the inelastic capture ratio. The inelastic mode of carbon-oxygen data requires investigation depths of 6 to 8 inches. Obtaining high-energy inelastic data is associated with high statistical uncertainty, so it is recommended to record 3 to 5 transitions with a stable recording speed of about 3 ft / min.
Since carbon binds to oil and oxygen to water, the carbon-oxygen ratio (C / O) is a direct indicator of oil saturation in the tank. The carbon-oxygen ratio is high in oil areas and low in water areas. The only problem in the oil saturation indicator referred to in the C / O ratio is lithology, as carbonates have carbon in their lithology, for example limestone is CaCO3 and dolomite is CaMg (CO3) 2. Most of the largest reservoirs in the world are mostly limestone carbonates and dolomites. Due to the presence of carbon in the carbonate, the C / O ratio in the carbonate increases even with the absence of any oil in the tank. This problem is solved by properly typing the tool for different lithologies and using the Calcium / Silicon (Ca / Si) ratio as a lithological indicator. The Ca / Si ratio will be high compared to carbonates, but low in classical subjects.
Typical pulsed neutron tool type:
For the correct interpretation of carbon-oxygen, the neutron-pulsating means must be typified. Typography provides variability in the measurement of lithologies and different types of fluids. Each trader has its own typification laboratory for measuring inelastic data by fluid type and lithology. In these typification laboratories are present several test pits with lithology and different types of fluids, in which are typified tools for the development of the algorithm in terms of inelastic interpretation.
Data extraction:
Various elemental yields, such as carbon yield, oxygen yield, calcium yield and silicon yield are obtained from the inelastic spectra recorded by the vehicle. There are two methods for obtaining elementary yield. The first is known as the “Windows Method” and the second is “Spectrum Analysis”. In windows methods a window is created around the most prominent point, the energy of a certain element to evaluate its elemental efficiency. The Windows method has high accuracy referring to the statistics it provides. On the other hand, in terms of spectrum analysis, the elemental signature of the elements is the same for all cases. Since the elements have more than one characteristic energy peak and spectrum analysis takes care of each of them, this method results in a more accurate estimation of the element performance compared to the windows method but its accuracy is lower than the first method. One of the mentioned methods is usually used for the evaluation of elementary yield. However, one of Schlumberger’s service companies uses a mathematical model called “alpha processing” in its algorithm. This model helps increase accuracy and precision. In alpha processing, data obtained from the window method and spectrum analysis are combined. The rated efficiencies of each detector are used to measure the C / O ratio, Ca / Si ratio for both near and far detectors.
Interpretation:
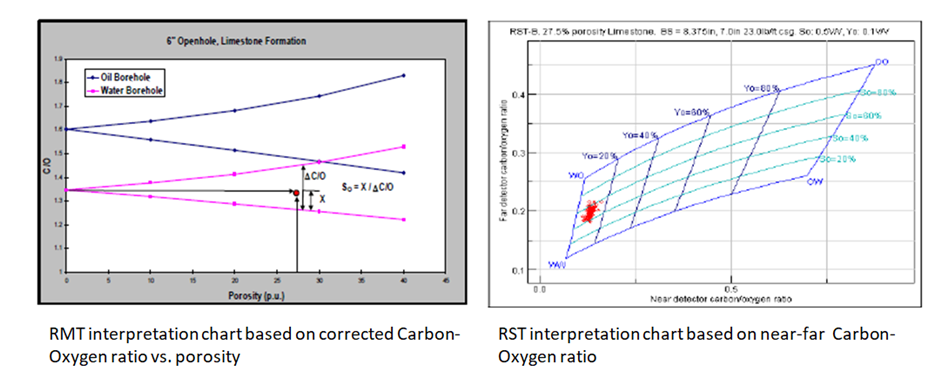
Service companies have different approaches to interpreting inelastic C / O data regarding oil saturation. Schlumberger’s RST-D device by concentrating its proximity detector in the well and the remote detector in the formation, realizes a parallelogram of the remote C / O ratio to the near C / O ratio – for the porosity given based on the data created through typification. On the other hand, Halliburton’s module on C / O interpretation is a graph of the C / O ratio corrected in the basic set of porosity conditions. The interpretation approach otherwise called the dynamic response generator is used.
The response equation for Schlumberger’s parallelogram interpretation method is as follows:
C/O = (K1 + K2* Phi* So + K3 *Yo ) / (K4 + K5 (1-So) + K6( 1-Yo) )
In the above equation C is the yield of carbon, O is the yield of oxygen, Phi is the porosity, So is the saturation of the oil and Y0 is the holding of the well oil. Ki coefficients represent the sensitivity of matrix, forming fluid and drilling fluids to carbon and oxygen. The values for these coefficients are determined in the calibration test holes.
Halliburton uses the Windows method to evaluate element yields. The C / O data response equation for oil saturation using the Halliburton fan graph is given below:
LIRI = (0.32 *Vls + 0.30) * (1- Phi) + 1.505
Where FREEDOM is the Ca / Si ratio also known as the lithological ratio, Vls is the volume of calcite and Phi is the porosity.
Delta CO = COIR – 0.15 *LIRI + 0.07 *Phi – 0.263 +A
Where COIR is the corrected C / O environmental ratio and reduced to the base condition group, Phi is the porosity, A is constant to take care of the residual effect.
Soil = 1.53 * ((1 -0.35 *Phi)/Phi) – ((Delta C/O)/ (Delta C/O + 0.19 * Chc))
In the above equation “Soil” is the oil saturation estimated using the C / O delta while Chc is the carbon carbon index of the oil.
Dynamic Response Generator is an interpretation method that uses a database of thousands of measured laboratory environments, which correlate the C / O ratio with the oil saturation value.
The dynamic range of the C / O ratio versus oil saturation decreases with decreasing porosity, as a result, a slight change in the C / O ratio can lead to a large and unreasonable change in low porosity oil saturation. Therefore, porosity less than 12% is not considered in the interpretation of oil saturation using the C / O ratio.
Below is an example of comparing the C / O interpretation with the ELAN Sw interpretation of the Elementary Registry Analysis. In the following example we can clearly see on track 5 that the contact with the oil water has shifted to 7752ft from 7750m ago. The high carbon-oxygen ratio from 7702 to 7709 ft is coal seam.